
CloudWatch is great for observing and monitoring resources and applications on AWS, on premises, and on other clouds.
While it's trivial to have the agent running on Linux, it's a bit more involved for mac instances (which are commonly used as CI workers). The support was announced in January 2021 for mac1.metal (Intel/x86_64) and I bumped into some challenges on mac2.metal (M1/ARM64) that the team at AWS helped me solve (see this issue on the GitHub repo).
I couldn't find other articles nor precise documentation from AWS which is why I'm writing this article to walk you through a common CloudWatch setup.
The given code samples are for the HashiCorp tools Packer and Terraform and focus on mac2.metal instances.
I'll cover the following steps:
- install the CloudWatch agent on mac2.metal instances
- configure the CloudWatch agent
- create a CloudWatch dashboard
- setup CloudWatch alarms
- setup IAM permissions
Install the CloudWatch agent
The CloudWatch agent can be installed by downloading the pkg file listed on this page and running the installer. You probably want to bake the agent into your AMI, so here is the Packer code for mac2.metal (ARM):
# Install wget via brew
provisioner "shell" {
  inline = [
    "source ~/.zshrc",
    "brew install wget"
  ]
}

# Install CloudWatch agent
provisioner "shell" {
  inline = [
    "source ~/.zshrc",
    "wget https://s3.amazonaws.com/amazoncloudwatch-agent/darwin/arm64/latest/amazon-cloudwatch-agent.pkg",
    "sudo installer -pkg ./amazon-cloudwatch-agent.pkg -target /"
  ]
}
For the agent to work, you'll need collectd (https://collectd.org/) to be installed on the machine, which is usually done via brew. Brew installs it at /opt/homebrew/sbin/. This is also a step you want to perform when creating your AMI.
# Install collectd via brew
provisioner "shell" {
  inline = [
    "source ~/.zshrc",
    "brew install collectd"
  ]
}
Configure the CloudWatch agent
In order to run, the agent needs a configuration which can be created using the wizard. This page defines the metric sets that are available.
Running the wizard with the command below will allow you to generate a basic json configuration which you can modify later.
sudo /opt/aws/amazon-cloudwatch-agent/bin/amazon-cloudwatch-agent-config-wizardThe following is a working configuration for Mac instances so you can skip the process.
{
	"agent": {
	  "metrics_collection_interval": 60,
	  "run_as_user": "root"
	},
	"metrics": {
	  "aggregation_dimensions": [
		[
		  "InstanceId"
		]
	  ],
	  "append_dimensions": {
		"AutoScalingGroupName": "${aws:AutoScalingGroupName}",
		"ImageId": "${aws:ImageId}",
		"InstanceId": "${aws:InstanceId}",
		"InstanceType": "${aws:InstanceType}"
	  },
	  "metrics_collected": {
		"collectd": {
		  "collectd_typesdb": [
			"/opt/homebrew/opt/collectd/share/collectd/types.db"
		  ],
		  "metrics_aggregation_interval": 60
		},
		"cpu": {
		  "measurement": [
			"cpu_usage_idle",
			"cpu_usage_iowait",
			"cpu_usage_user",
			"cpu_usage_system"
		  ],
		  "metrics_collection_interval": 60,
		  "resources": [
			"*"
		  ],
		  "totalcpu": false
		},
		"disk": {
		  "measurement": [
			"used_percent",
			"inodes_free"
		  ],
		  "metrics_collection_interval": 60,
		  "resources": [
			"*"
		  ]
		},
		"diskio": {
		  "measurement": [
			"io_time",
			"write_bytes",
			"read_bytes",
			"writes",
			"reads"
		  ],
		  "metrics_collection_interval": 60,
		  "resources": [
			"*"
		  ]
		},
		"mem": {
		  "measurement": [
			"mem_used_percent"
		  ],
		  "metrics_collection_interval": 60
		},
		"netstat": {
		  "measurement": [
			"tcp_established",
			"tcp_time_wait"
		  ],
		  "metrics_collection_interval": 60
		},
		"statsd": {
		  "metrics_aggregation_interval": 60,
		  "metrics_collection_interval": 10,
		  "service_address": ":8125"
		},
		"swap": {
		  "measurement": [
			"swap_used_percent"
		  ],
		  "metrics_collection_interval": 60
		}
	  }
	}
  }
I have enhanced the output of the wizard with some reasonable metrics to collect. The configuration created by the wizard is almost working but it's lacking a fundamental config to make it work out-of-the-box: the collectd_typesdb value.
Linux and Mac differ when it comes to the location of collectd and types.db, and the agent defaults to the Linux path even if it was built for Mac, causing the following error when trying to run the agent:
======== Error Log ========
2023-07-23T04:57:28Z E! [telegraf] Error running agent: Error loading config file /opt/aws/amazon-cloudwatch-agent/etc/amazon-cloudwatch-agent.toml: error parsing socket_listener, open /usr/share/collectd/types.db: no such file or directory
Moreover, the /usr/share/ folder is not writable unless you disable SIP (System Integrity Protection) which cannot be done on EC2 mac instances nor is something you want to do for security reasons.
The final configuration is something you want to save in System Manager Parameter Store using the ssm_parameter resource in Terraform:
resource "aws_ssm_parameter" "cw_agent_config_darwin" {
  name        = "/cloudwatch-agent/config/darwin"
  description = "CloudWatch agent config for mac instances"
  type        = "String"
  value       = file("./cw-agent-config-darwin.json")
}
and use it when running the agent in a provisioning step:
resource "null_resource" "run_cloudwatch_agent" {
depends_on = [
aws_instance.mac_instance
]
connection {
type = "ssh"
agent = false
host = aws_instance.mac_instance.private_ip
user = "ec2-user"
private_key = tls_private_key.mac_instance.private_key_pem
timeout = "30m"
}
# Run CloudWatch agent
provisioner "remote-exec" {
inline = [
"sudo /opt/aws/amazon-cloudwatch-agent/bin/amazon-cloudwatch-agent-ctl -a fetch-config -m ec2 -s -c ssm:${aws_ssm_parameter.cw_agent_config_darwin.name}"
]
}
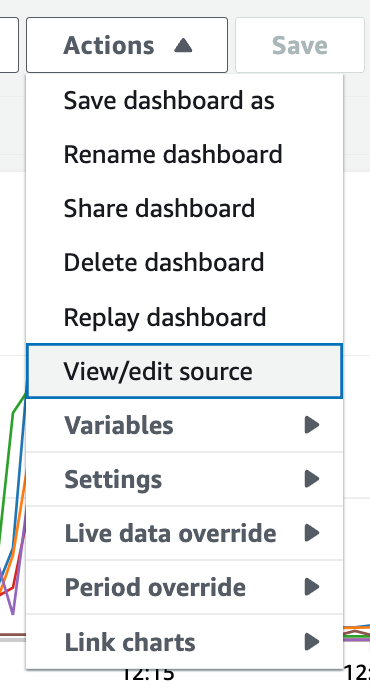
}Create a CloudWatch dashboard
Once the instances are deployed and running, they will send events to CloudWatch and we can create a dashboard to visualise them. You can create a dashboard manually in the console and once you are happy with it, you can just copy the source code, store it in a file and feed it to Terraform.
Here is mine that could probably work for you too if you tag your instances with the Type set to macOS:
{
    "widgets": [
        {
            "height": 15,
            "width": 24,
            "y": 0,
            "x": 0,
            "type": "explorer",
            "properties": {
                "metrics": [
                    {
                        "metricName": "cpu_usage_user",
                        "resourceType": "AWS::EC2::Instance",
                        "stat": "Average"
                    },
                    {
                        "metricName": "cpu_usage_system",
                        "resourceType": "AWS::EC2::Instance",
                        "stat": "Average"
                    },
                    {
                        "metricName": "disk_used_percent",
                        "resourceType": "AWS::EC2::Instance",
                        "stat": "Average"
                    },
                    {
                        "metricName": "diskio_read_bytes",
                        "resourceType": "AWS::EC2::Instance",
                        "stat": "Average"
                    },
                    {
                        "metricName": "diskio_write_bytes",
                        "resourceType": "AWS::EC2::Instance",
                        "stat": "Average"
                    }
                ],
                "aggregateBy": {
                    "key": "",
                    "func": ""
                },
                "labels": [
                    {
                        "key": "Type",
                        "value": "macOS"
                    }
                ],
                "widgetOptions": {
                    "legend": {
                        "position": "bottom"
                    },
                    "view": "timeSeries",
                    "stacked": false,
                    "rowsPerPage": 50,
                    "widgetsPerRow": 1
                },
                "period": 60,
                "splitBy": "",
                "region": "eu-west-1"
            }
        }
    ]
}
You can then use the cloudwatch_dashboard resource in Terraform:
resource "aws_cloudwatch_dashboard" "mac_instances" {
  dashboard_name = "mac-instances"
  dashboard_body = file("./cw-dashboard-mac-instances.json")
}
It will show something like this:
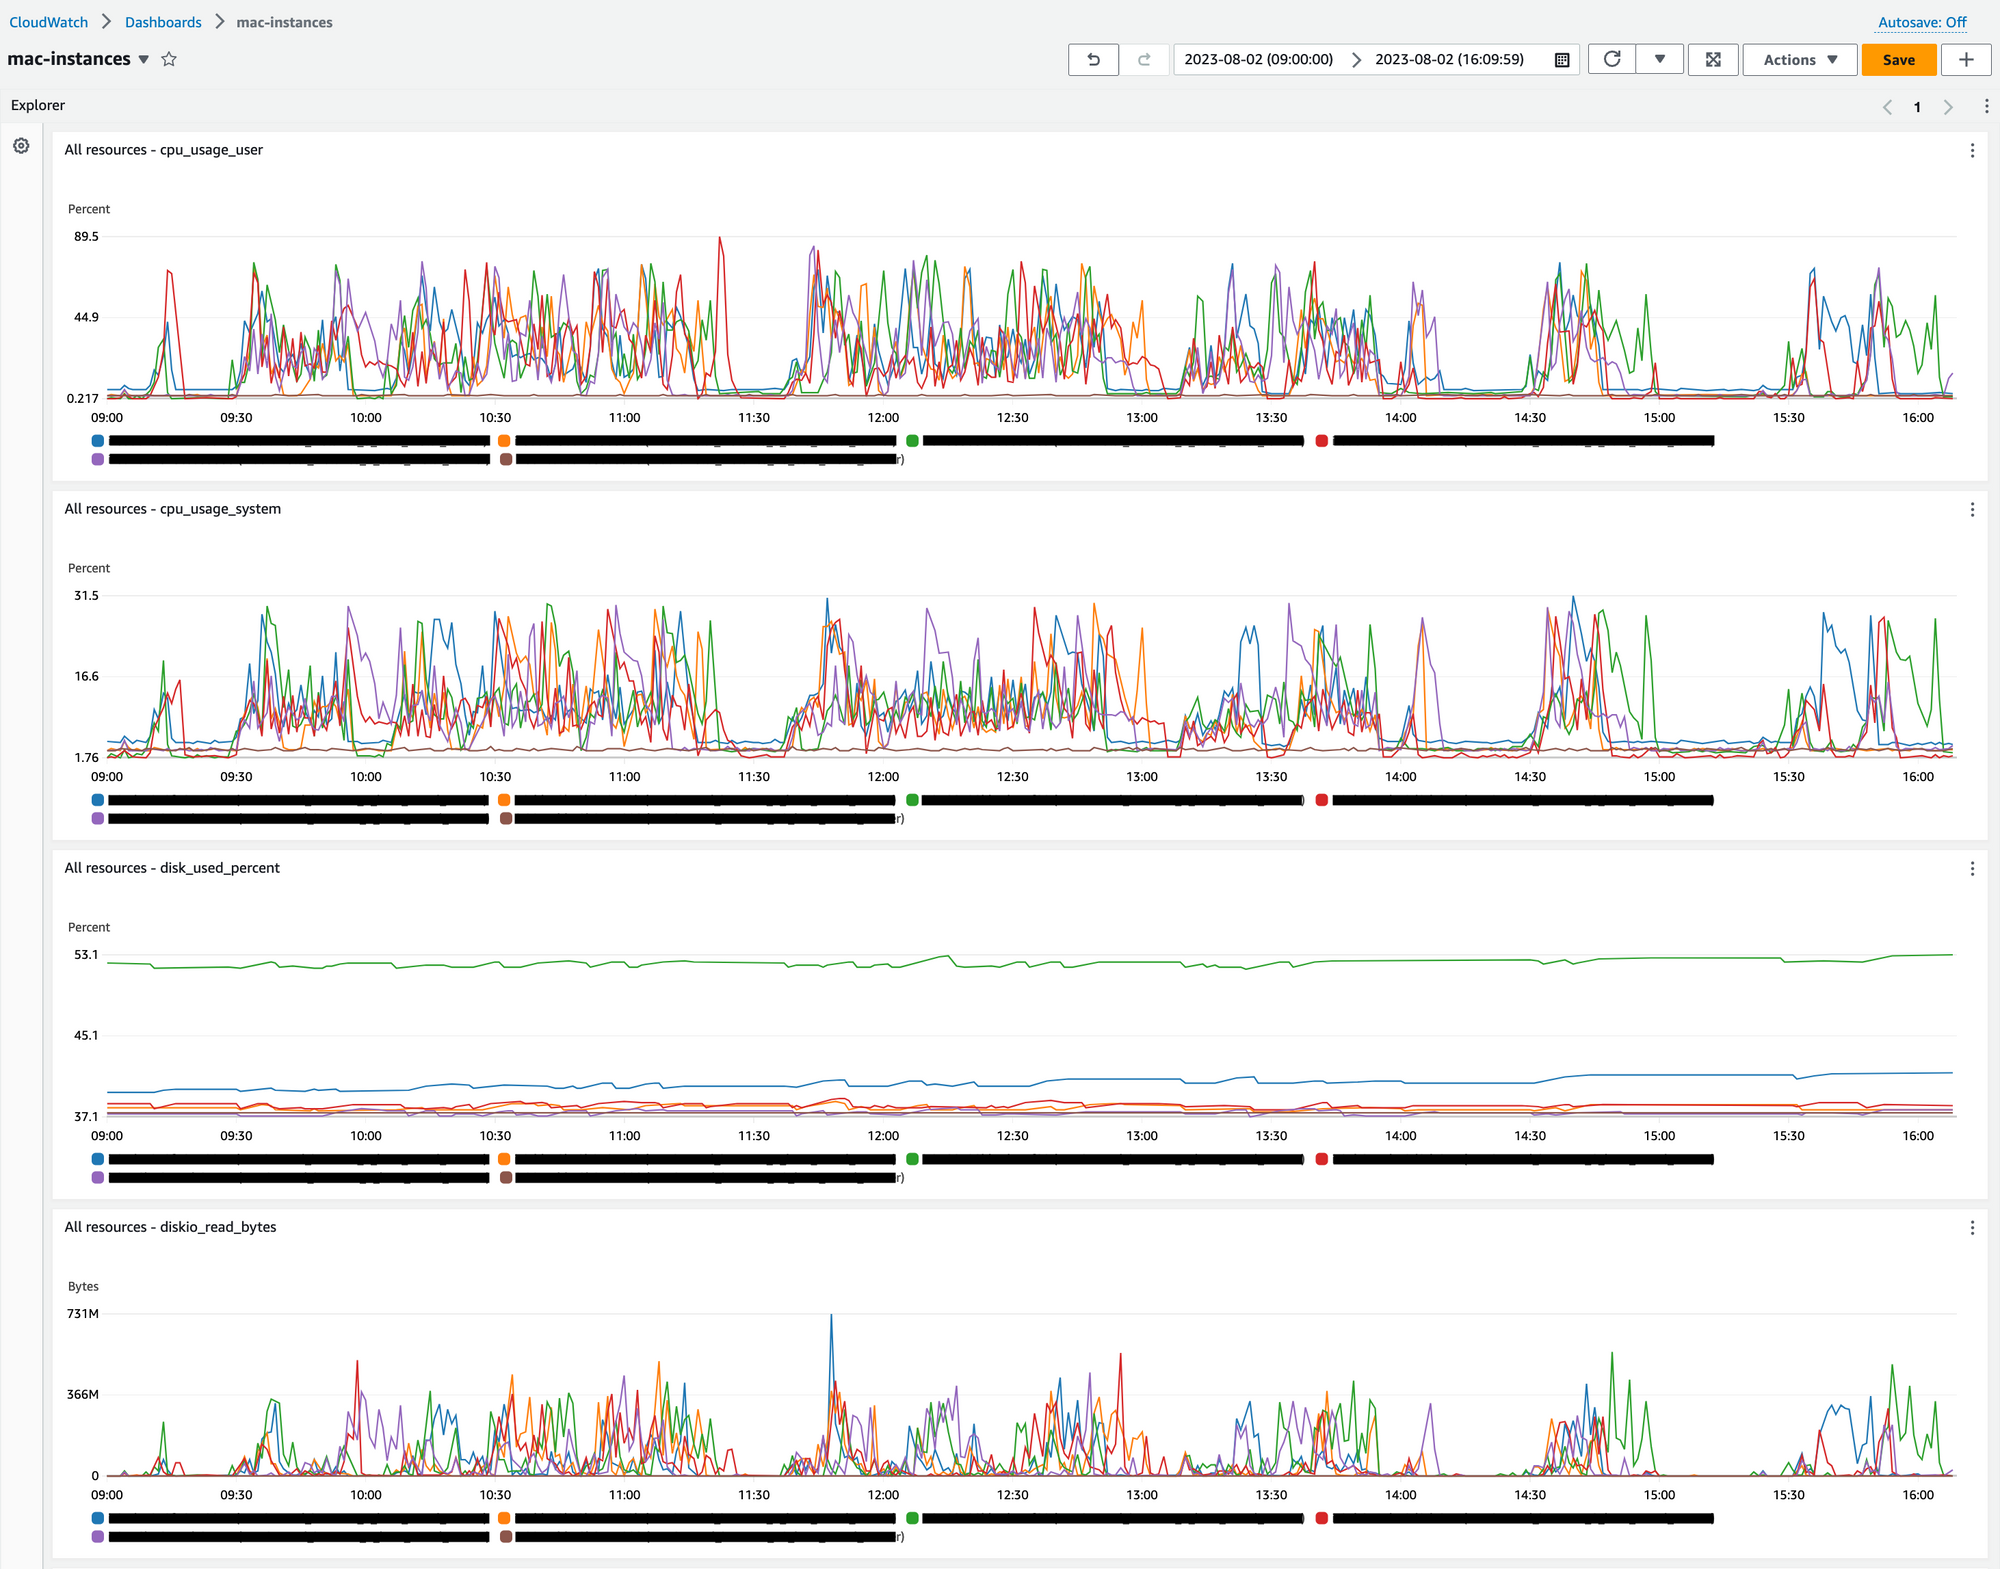
Setup CloudWatch alarms
Once the dashboard is up, you should set up alarms so that you are notified of any anomalies, rather than actively monitoring the dashboard for them.
What works for me is having alarms triggered via email when the used disk space is going above a certain level (say 80%). We can use the cloudwatch_metric_alarm resource.
resource "aws_cloudwatch_metric_alarm" "disk_usage" {
  alarm_name          = "mac-${aws_instance.mac_instance.id}-disk-usage"
  comparison_operator = "GreaterThanThreshold"
  evaluation_periods  = 30
  metric_name         = "disk_used_percent"
  namespace           = "CWAgent"
  period              = 120
  statistic           = "Average"
  threshold           = 80
  alarm_actions       = [aws_sns_topic.disk_usage.arn]
  dimensions = {
    InstanceId = aws_instance.mac_instance.id
  }
}
We can then create an SNS topic and subscribe all interested parties to it. This will allow us to broadcast to all subscribers when the alarm is triggered. For this, we can use the sns_topic and sns_topic_subscription resources.
resource "aws_sns_topic" "disk_usage" {
  name = "CW_Alarm_disk_usage_mac_${aws_instance.mac_instance.id}"
}

resource "aws_sns_topic_subscription" "disk_usage" {
  for_each  = toset(var.alarm_subscriber_emails)
  topic_arn = aws_sns_topic.disk_usage.arn
  protocol  = "email"
  endpoint  = each.value
}

variable "alarm_subscriber_emails" {
  type = list(string)
}
If you are deploying your infrastructure via GitHub Actions, you can set your subscribers as a workflow input or as an environment variable. Here is how you should pass a list of strings via a variable in Terraform:
name: Deploy Mac instance

env:
  ALARM_SUBSCRIBERS: '["user1@example.com","user2@example.com"]'
  AMI: ...

jobs:
  deploy:
    ...
    steps:
      - name: Terraform apply
        run: |
          terraform apply \
            --var ami=${{ env.AMI }} \
            --var alarm_subscriber_emails='${{ env.ALARM_SUBSCRIBERS }}' \
            --auto-approve
Setup IAM permissions
The instance that performs the deployment requires permissions for CloudWatch, System Manager, and SNS.
The following is a policy that is enough to perform both terraform apply and terraform destroy. Please consider restricting to specific resources.
{
    "Version": "2012-10-17",
    "Statement": [
        {
            "Sid": "CloudWatchDashboardsPermissions",
            "Effect": "Allow",
            "Action": [
                "cloudwatch:DeleteDashboards",
                "cloudwatch:GetDashboard",
                "cloudwatch:ListDashboards",
                "cloudwatch:PutDashboard"
            ],
            "Resource": "*"
        },
        {
            "Sid": "CloudWatchAlertsPermissions",
            "Effect": "Allow",
            "Action": [
                "cloudwatch:DescribeAlarms",
                "cloudwatch:DescribeAlarmsForMetric",
                "cloudwatch:DescribeAlarmHistory",
                "cloudwatch:DeleteAlarms",
                "cloudwatch:DisableAlarmActions",
                "cloudwatch:EnableAlarmActions",
                "cloudwatch:ListTagsForResource",
                "cloudwatch:PutMetricAlarm",
                "cloudwatch:PutCompositeAlarm",
                "cloudwatch:SetAlarmState"
            ],
            "Resource": "*"
        },
        {
            "Sid": "SystemsManagerPermissions",
            "Effect": "Allow",
            "Action": [
                "ssm:GetParameter",
                "ssm:GetParameters",
                "ssm:ListTagsForResource",
                "ssm:DeleteParameter",
                "ssm:DescribeParameters",
                "ssm:PutParameter"
            ],
            "Resource": "*"
        },
        {
            "Sid": "SNSPermissions",
            "Effect": "Allow",
            "Action": [
                "sns:CreateTopic",
                "sns:DeleteTopic",
                "sns:GetTopicAttributes",
                "sns:GetSubscriptionAttributes",
                "sns:ListSubscriptions",
                "sns:ListSubscriptionsByTopic",
                "sns:ListTopics",
                "sns:SetSubscriptionAttributes",
                "sns:SetTopicAttributes",
                "sns:Subscribe",
                "sns:Unsubscribe"
            ],
            "Resource": "*"
        }
    ]
}
On the other hand, to send logs to CloudWatch, the Mac instances require permissions given by the CloudWatchAgentServerPolicy:
resource "aws_iam_role_policy_attachment" "mac_instance_iam_role_cw_policy_attachment" {
  role       = aws_iam_role.mac_instance_iam_role.name
  policy_arn = "arn:aws:iam::aws:policy/CloudWatchAgentServerPolicy"
}
Conclusion
You have now defined your CloudWatch dashboard and alarms using "Infrastructure as Code" via Packer and Terraform. I've covered the common use case of instances running out of space on disk which is useful to catch before CI starts becoming unresponsive slowing your team down.